Showing trends in key management indicators.
(unit: million Yen)
| Fiscal year-end | 22/3 | 23/3 | 24/3 | 25/3 | 26/3 |
|---|---|---|---|---|---|
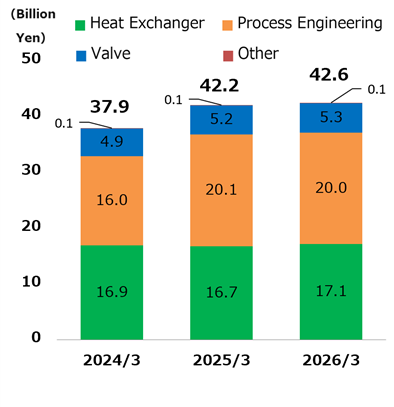
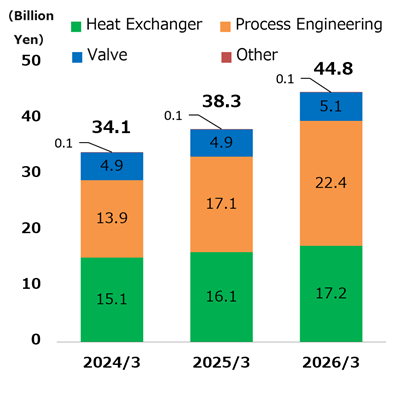
| Net sales | 30,085 | 34,074 | 34,180 | 38,353 | 44,890 |
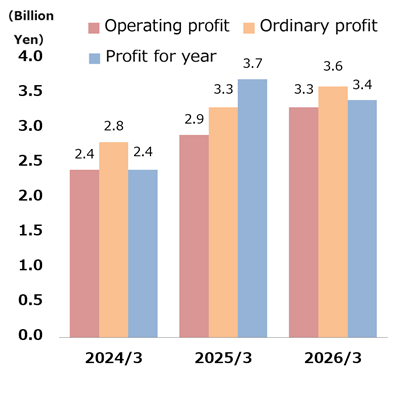
| Ordinary profit | 2,270 | 2,392 | 2,896 | 3,391 | 3,620 |
| Profit attributable to owners of parent | 2,058 | 2,040 | 2,420 | 3,782 | 3,449 |
| Share capital | 4,150 | 4,150 | 4,150 | 4,150 | 4,150 |
| Total number of shares issued | 32,732,800 | 32,732,800 | 32,732,800 | 28,732,800 | 28,732,800 |
| Net assets | 54,378 | 56,302 | 60,301 | 60,019 | 63,280 |
| Total assets | 67,302 | 70,977 | 82,017 | 82,697 | 83,082 |
| Net assets per share (Yen) | 1,927.39 | 1,992.64 | 2,125.77 | 2,188.25 | 2,397.55 |
| Dividend per share (Yen) (including interim dividend per share) |
30.00 (15.00) |
40.00 (20.00) * Commemorative dividend 10 Yen |
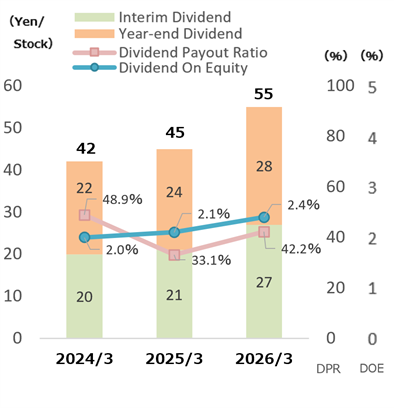
42.00 (20.00) | 45.00 (21.00) | 55.00 (27.00) |
| Earnings per share (Yen) | 73.19 | 72.45 | 85.83 | 135.78 | 130.21 |
| Equity ratio | 80.6% | 79.1% | 73.1% | 72.1% | 75.9% |
| Return on equity | 3.8% | 3.7% | 4.2% | 6.3% | 5.6% |
| Price-earnings ratio (Times) | 10.85 | 12.33 | 11.87 | 7.29 | 11.77 |
| Dividend payout ratio | 41.0% | 55.2% | 48.9% | 33.1% | 42.2% |